Analytics Overview
Analytics Features
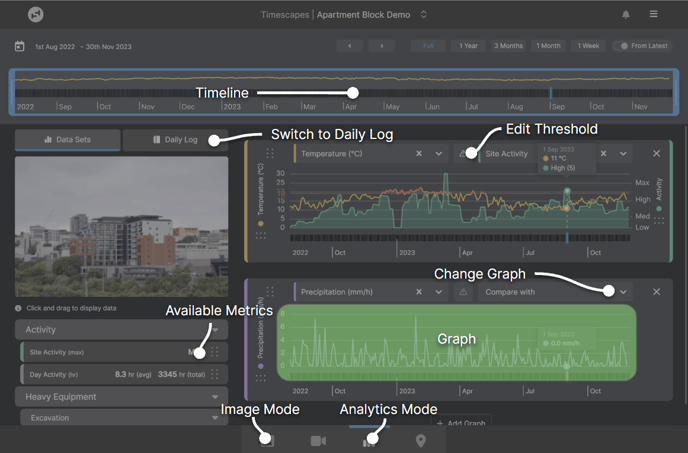
Graph
Data is displayed on graph panels. You can add Panels using the 'Add Graph' button at the bottom, and remove then using the ✖ icon in the top right corner.
Moving your mouse cursor over a graph will show the values at the given time.
Clicking & dragging will allow you to zoom in, or quickly view a timelapse for the selected time-period.
Timeline
The timeline shows the entire length of the project, and the blue box shows the time-period that you're currently viewing. Click & drag to change the time-period being shown.
You can also drag a metric onto the Timeline to plot it over the entire duration of the project.
Daily Log
The Daily Log shows a summary of key information for the selected day, or time-period.
Use the ![]() icon to copy the summary to the clipboard. If viewing a large time-period, the
icon to copy the summary to the clipboard. If viewing a large time-period, the ![]() icon can be used to bulk export a day-by-day summary spreadsheet.
icon can be used to bulk export a day-by-day summary spreadsheet.
To quickly view a Daily Log summary for a specific day, click on Time-Axis on a graph and select 'View Daily Log'
Edit Threshold
Click the ⚠ icon to set or edit a threshold for the metric. This can be done for Weather & IoT Sensor data. Any readings above the threshold will be highlighted on the graph.
Available Metrics
Available metrics are displayed here. This may include
- Historical weather data such as Temperature, Precipitation, Wind
- Analytics from Timescapes Machine-Learning such as Activity, Excavator Uptime, Concrete Activity etc.
- Data from on site IoT sensors that have been integrated into Timescapes
Change Graph
Use the dropdown to select another metric to display on this graph. You can have up to two metrics on one graph.
You can also change which metrics are being display by dragging a metric from the list on the left onto the graph.